AI Disclaimer: This article was generated with the assistance of AI. AI is prone to errors. Verify all data independently before making any investment decision.
Silver’s Outstanding Performance in 2025: Context and Magnitude
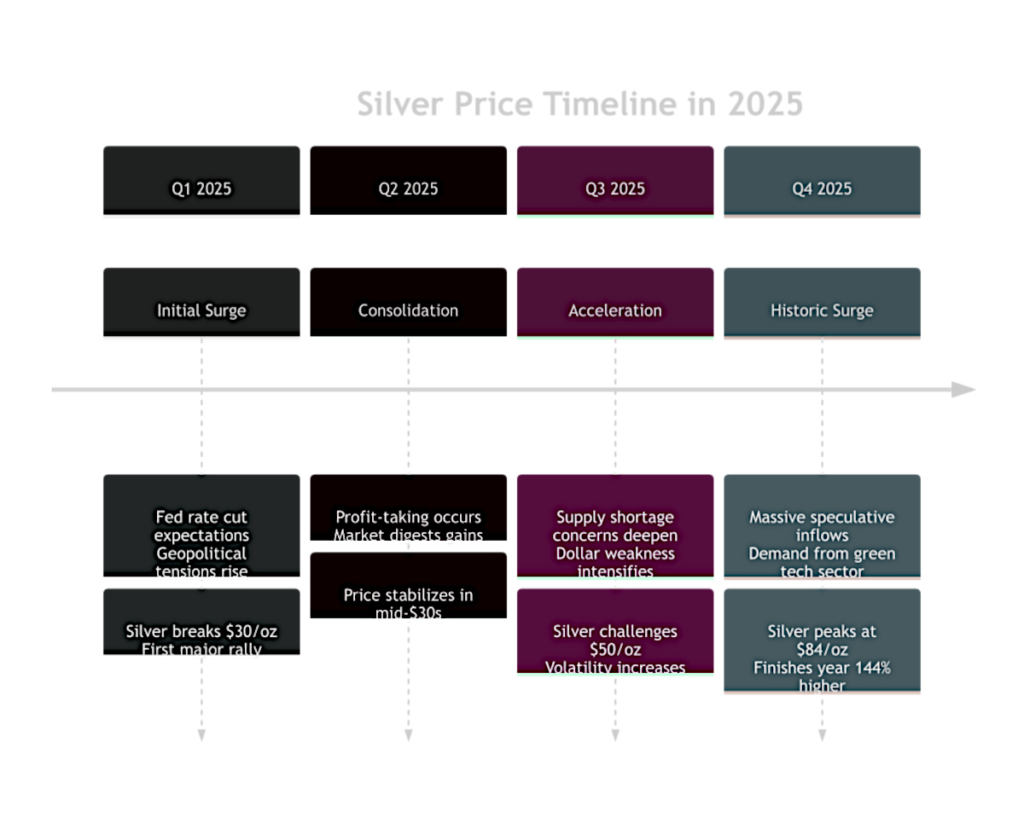
The precious metals market experienced a remarkable year in 2025, with silver emerging as the standout performer among all major asset classes. Silver prices surged an unprecedented 144% from January to December 2025, dramatically outperforming gold which still managed a respectable 64.9% gain for the year. This extraordinary performance made silver the best-performing asset globally in 2025, significantly surpassing equities, bonds, and other commodities. The price appreciation was particularly dramatic in the second half of the year, with silver gaining approximately 28% in December alone and briefly breaking above the $84 per ounce mark.
Table: Comparative Performance of Major Asset Classes in 2025
| Asset Class | 2025 Performance | Key Drivers |
|---|---|---|
| Silver | +144% | Supply shortage, industrial demand, macroeconomic uncertainty |
| Gold | +64.9% | Central bank buying, geopolitical tension, monetary easing |
| Platinum | +110% | Supply constraints, automotive demand, ETF inflows |
| Copper | +44.3% | Supply disruptions, green energy demand, infrastructure spending |
| US Equities (S&P 500) | ~18% | Economic growth, corporate earnings, rate cut expectations |
| US Treasuries | Negative returns | Rate hike persistence, inflation concerns, fiscal deficits |
This historic surge in silver prices occurred against a backdrop of significant economic and geopolitical uncertainty. The global economy faced headwinds from protectionist trade policies, particularly the implementation of broad tariff regimes by the United States which disrupted established supply chains and contributed to a weakening US dollar. The Federal Reserve’s monetary policy pivots created additional volatility, with three rate cuts throughout the year contributing to dollar depreciation and enhancing the appeal of precious metals as alternative assets. The unique combination of these factors created a “perfect storm” for silver prices, leveraging both its precious metal status and industrial metal properties to generate extraordinary returns.
2 Key Drivers Behind Silver’s 2025 Surge
2.1 Structural Supply-Demand Imbalance
The fundamental driver behind silver’s spectacular price appreciation was the persistent and widening supply deficit that has characterized the market for multiple years. In 2024, the global silver market experienced its fourth consecutive year of significant shortage, with a deficit of approximately 148.9 million ounces (4,632 tons) despite a 2% increase in supply and a 3% decrease in demand. This deficit continued to widen in 2025, with the Silver Institute reporting that supply growth remained constrained while industrial demand proved unexpectedly robust.
- Supply Constraints: Global mine production grew by only 0.9% in 2024 to reach 819.7 million ounces (25,497 tons), with growth primarily from lead/zinc mines in Australia and the recovery of supply from Mexico’s Peñasquito mine. This marginal increase was partially offset by lower output from Chile, which saw production decline by 8.8 million ounces year-over-year. The structural nature of these supply constraints became increasingly apparent, with CPM Group predicting that global mine supply would face “long-term constraints” and potentially decline by approximately 0.6% in 2025. The supply challenges were particularly acute in the primary silver segment, where declining ore grades and insufficient exploration investment over the preceding decade limited the ability of producers to respond to higher prices with increased output.
- Industrial Demand Expansion: While total silver demand decreased by 3% in 2024 to 1.16 billion ounces, this decline was entirely concentrated in physical investment and silverware segments. In contrast, industrial demand achieved a record year for the second consecutive year, reaching 680.5 million ounces (21,165 tons). This strength was underpinned by record electronics and electrical demand, which reflected structural gains in the green economy flowing through from the photovoltaic (PV) and automotive sectors, as well as grid infrastructure development. The photovoltaic sector alone accounted for approximately 197.6 million ounces of demand, representing 17% of total global silver consumption. The electrification trend across multiple industries created inelastic demand for silver, as its unique conductive properties make it difficult to substitute in many high-tech applications.
2.2 Macroeconomic and Monetary Factors
The macroeconomic environment of 2025 provided powerful tailwinds for silver prices, particularly through the weakening US dollar and shifts in Federal Reserve policy. The US dollar index experienced a decline of nearly 10% throughout 2025, as the market increasingly priced in Federal Reserve rate cuts. This depreciation was particularly pronounced in the second half of the year, as the Fed implemented three separate rate cuts that reduced the policy rate by 75 basis points in total. Since silver is priced in dollars, a weaker greenback makes silver more affordable to purchasers holding other currencies, thereby stimulating demand and supporting higher prices.
- Monetary Easing Expectations: The Federal Reserve’s pivot to a more accommodative stance was driven by increasing evidence of economic slowing in the United States. By the fourth quarter of 2025, real GDP growth had decelerated to just 0.1% year-over-year, while the PCE price index remained elevated at 4.0%. This combination of stagnant growth and persistent inflation created the classic “stagflation” environment that has historically been particularly favorable for precious metals. The market anticipated that this would necessitate further monetary easing, which reduces the opportunity cost of holding non-yielding assets like silver. According to the CME FedWatch Tool, by December 2025, the market was pricing in an additional 50 basis points of cuts for 2026, sustaining expectations of a continued low-rate environment.
- Safe Haven Demand: The geopolitical landscape became increasingly fraught throughout 2025, with multiple conflicts and trade tensions creating demand for safe haven assets. The US-China trade relationship deteriorated significantly with the implementation of broad tariff regimes, while tensions in the Middle East and Eastern Europe persisted. This environment drove significant flows into precious metals, with global gold ETF holdings increasing by 14.7 million ounces to 97.5 million ounces. While gold typically benefits most from safe haven demand, silver’s historical relationship with gold meant that it also benefited from these flows, particularly as it was seen as the more volatile but potentially more rewarding component of the precious metals complex.
2.3 Technical Dynamics and Speculative Activity
The price action in silver during 2025 exhibited classic characteristics of a speculative frenzy, particularly in the latter months of the year. The gold-silver ratio, which measures the number of ounces of silver required to purchase one ounce of gold, began the year at elevated levels above 104:1 but had contracted dramatically to approximately 64:1 by year-end. This rapid compression reflected both silver’s outperformance and a potential valuation disconnect from gold, suggesting that speculative factors had become increasingly dominant.
- Managed Money Positioning: The Commitment of Traders (COT) reports revealed that managed money positions in silver futures reached historically extreme levels by December 2025. Net long positions had increased dramatically from the beginning of the year, with speculative accounts establishing unprecedented bullish bets on the metal. This positioning created a self-reinforcing dynamic, as rising prices attracted additional speculative inflows which further pushed prices higher. However, it also created conditions for a sharp correction if sentiment shifted, as these traders were likely to exit positions simultaneously in response to any negative developments.
- ETF Inflows and Physical Demand: Exchange-traded products experienced substantial inflows throughout 2025, with silver ETF holdings increasing by approximately 62 million ounces in 2024 alone, marking the first annual positive inflows since 2021. This trend accelerated in 2025, with iShares Silver Trust and similar products seeing robust demand from both retail and institutional investors. The physical market tightened significantly, with reports of spot premiums reaching multi-year highs in key trading hubs like London and New York. The combination of strong ETF demand and industrial requirements created competition for physical metal, further supporting prices and potentially contributing to the backwardation observed in the futures curve during the fourth quarter.
3 Silver’s Investability in 2026: Speculative Excess or Fundamental Strength?
3.1 Arguments for Speculative Excess
Despite silver’s outstanding performance, several indicators suggest that speculative factors had become overly dominant by late 2025, potentially positioning the market for a correction in 2026. The most concerning signal was the extreme positioning in futures markets, with the speculative net long reaching levels that historically have preceded sharp reversals. The CFTC Commitment of Traders data indicated that non-commercial traders held historically large net long positions relative to open interest, a condition that often precedes price consolidation or decline as these positions are unwound.
- Valuation Concerns: The gold-silver ratio at approximately 64:1 represented its lowest level in several years, potentially indicating that silver had become expensive relative to gold. While this ratio could theoretically fall further (it briefly touched 30:1 during the 1980 Hunt Brothers bubble), the rapid compression from 104:1 in just 12 months suggested that silver’s performance had been disconnected from gold’s fundamentals. Technical analysts pointed out that the parabolic increase in silver prices during the fourth quarter of 2025 resembled previous blow-off tops that often precede significant corrections. The velocity of the price advance, particularly the nearly 30% gain in December alone, was characteristic of excessive speculation rather than sustainable fundamental buying.
- Demand Destruction Potential: The law of demand suggests that at sufficiently high prices, consumers will seek alternatives or reduce consumption. By late 2025, silver at $84 per ounce was approaching levels that could begin to incentivize substitution efforts in industrial applications. While silver’s unique properties make it difficult to replace in many uses, extended high prices would likely accelerate research into alternatives such as aluminum or graphene in certain applications. Furthermore, the jewelry and silverware segments had already shown signs of demand elasticity, with global jewelry demand expected to decline by approximately 5% in 2025 due to high prices. If industrial demand also began to moderate due to substitution efforts, the market balance could shift from deficit to surplus more quickly than anticipated.
3.2 Fundamental Support Arguments
Conversely, compelling arguments exist that silver’s gains are fundamentally justified and may be sustainable or even extend further in 2026. The structural supply-demand imbalance that has characterized the market for years remains unresolved, with few signs of significant supply response on the horizon. The Silver Institute projected that the market deficit would persist in 2026, albeit at a somewhat reduced level of approximately 117.6 million ounces. This continued deficit indicates that the market remains in a fundamental deficit even after accounting for the price increases of 2025.
- Green Energy Transition Acceleration: The energy transition represents perhaps the most powerful long-term driver for silver demand, with virtually no sign of slowing in 2026. The photovoltaic industry is undergoing a technological transformation from P-type to N-type cells (such as TOPCon and HJT), which typically require 50% more silver per cell than previous technologies. Despite ongoing “thrifting” efforts to reduce silver content per cell, the efficiency requirements of advanced cells have created a Jevons paradox where efficiency gains lead to more, not less, silver consumption. The International Energy Agency projects that solar capacity additions will continue at record rates through 2030, with no viable substitute for silver’s conductive properties in the near term. Additionally, the electrification of vehicles continues to accelerate, with each electric vehicle containing approximately 1-2 ounces of silver in various electronic components.
- Supply Inelasticity: The silver supply chain faces profound challenges that prevent rapid response to higher prices. Approximately 70% of silver supply comes as a byproduct of base metal mining (primarily lead, zinc, and copper). This means that silver production is largely dependent on investment decisions and production rates for other metals, not silver prices specifically. With base metal prices also elevated but facing their own demand headwinds from economic slowing, there is limited incentive for miners to expand capacity significantly. Furthermore, the quality of ore deposits has been declining globally, leading to lower grades and higher production costs that constrain supply growth even when prices are attractive. The lead time for new mine development (10-15 years) means that even if substantial investment began today, meaningful new supply would not hit the market for many years.
Table: Silver Supply-Demand Balance Assessment for 2026
| Factor | 2025 Status | 2026 Outlook | Implication for Price |
|---|---|---|---|
| Mine Supply | +0.9% growth | +2% growth (25,971 tons) | Modest increase, insufficient to meet demand |
| Recycling | +6% (193.9 Moz) | Moderate growth | Limited potential to offset mine deficits |
| Industrial Demand | Record high (680.5 Moz) | Continued growth | Primary driver, especially from green tech |
| Investment Demand | Strong recovery | Expected moderation | Volatile component, may offset price gains |
| Overall Market Balance | Deficit of 148.9 Moz | Deficit of 117.6 Moz | Structural deficit continues |
4 Long-Term Silver Outlook: Key Price Drivers to 2030
The long-term prospects for silver appear exceptionally bright based on multiple structural drivers that should support elevated prices for the remainder of the decade. The fundamental story for silver is arguably more compelling than for any other major commodity, as it sits at the nexus of powerful secular trends in monetary policy, industrial application, and energy technology. Understanding these long-term drivers is essential for investors looking beyond the near-term volatility and seeking to capitalize on the silver supercycle.
4.1 Industrial Demand from Green Technologies
The electrification and decarbonization of the global economy represents the most significant demand driver for silver over the coming decade. The energy transition is material-intensive, and no metal is more critical to this transformation than silver due to its unparalleled electrical and thermal conductivity. The International Energy Agency’s Net Zero Emissions scenario calls for a massive expansion of renewable energy capacity, with solar photovoltaic installations needing to increase by approximately 25% annually through 2030. This deployment alone will require substantial additional silver consumption.
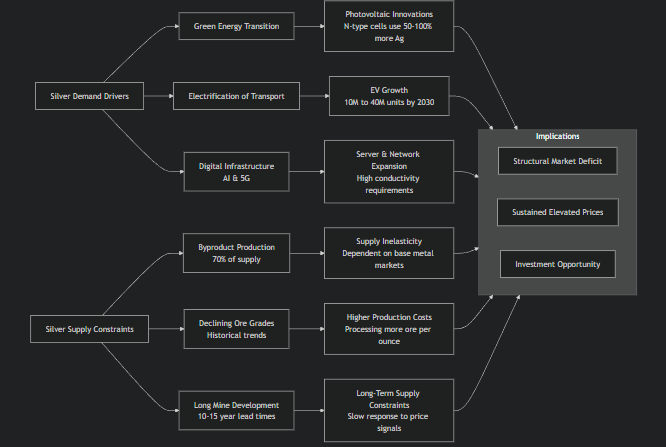
- Photovoltaic Innovations: The solar industry is undergoing a rapid technological evolution that is actually increasing silver intensity per watt of generating capacity. The shift from P-type to N-type cells (including TOPCon, HJT, and back-contact technologies) typically requires 50-100% more silver paste per cell than previous generation technologies. Despite significant R&D investment into silver reduction techniques, the fundamental physics of these advanced cells requires more silver for electrical contacts and current collection. Industry analysts project that the average silver content per watt will actually increase through 2026 before beginning a gradual decline as new technologies mature. This means that even as solar module efficiency improves, the total silver demand per gigawatt of installed capacity is likely to increase in the near term.
- Automotive Electrification: The transportation sector is undergoing a once-in-a-century transformation from internal combustion engines to electric vehicles (EVs). Each EV contains approximately 1-2 ounces of silver in various electronic components, including onboard chargers, battery management systems, and infotainment systems. With global EV production projected to grow from approximately 10 million units in 2022 to over 40 million units by 2030, this represents a significant new source of demand. Additionally, the charging infrastructure required to support this EV fleet will create additional silver demand in the form of cables, connectors, and transformers. The combined effect of vehicle electrification and renewable energy deployment could increase industrial silver demand by 30-40% by 2030 according to some projections.
4.2 Supply Constraints and Depletion
The supply side of the silver equation faces perhaps even more profound challenges than the demand side, with multiple factors constraining production growth for the foreseeable future. The geological reality of silver mining is that the easiest-to-access, highest-grade deposits have already been exploited, leaving lower-grade, more geologically complex deposits for future production. This reality has profound implications for the long-term supply curve and suggests that production growth will struggle to keep pace with even conservative demand growth scenarios.
- Byproduct Production Dynamics: The structure of the silver mining industry creates a inherent constraint on supply growth. Approximately 70% of silver supply is produced as a byproduct of other metal mining operations, primarily lead/zinc and copper mines. This means that silver mine supply is largely determined by investment decisions and production rates for these base metals, not by silver prices themselves. With base metal prices facing their own demand headwinds from economic slowing and trade tensions, there is limited incentive for miners to expand capacity. Even when base metal prices are high, new mine development typically takes 10-15 years from discovery to first production, creating a significant lag between price signals and supply response. This structural feature of the silver supply chain creates a persistent supply inelasticity that should support elevated prices even during economic slowdowns.
- Declining Ore Grades: The quality of silver deposits has been declining globally for decades, a trend that appears likely to accelerate rather than reverse. The average grade of silver ore mined has fallen from approximately 500 grams per ton in the 1970s to less than 150 grams per ton today in many major producing regions. This decline means that miners must process increasingly larger volumes of ore to produce the same amount of silver, leading to higher energy consumption, environmental impact, and production costs. The trend is particularly pronounced in historic mining districts like Mexico, Peru, and Australia, which have produced for centuries and are now exhausting their highest-grade ores. While new discoveries are still being made, they are typically smaller, lower-grade, and more remote than historical deposits, making their development more challenging and expensive.
4.3 Monetary and Financial Market Factors
Beyond industrial and supply-demand fundamentals, silver’s role as a monetary asset and financial instrument will continue to influence its price trajectory over the long term. The global monetary system is undergoing a gradual transformation as central banks and investors seek alternatives to the US dollar in response to structural fiscal deficits, political polarization, and the weaponization of financial systems through sanctions. This trend has significant implications for precious metals including silver, which have historically served as stores of value during periods of monetary system stress.
- Central Bank Diversification: While central banks primarily accumulate gold as a reserve asset, the precious metals complex benefits from this diversification trend. The World Gold Council reported that central banks purchased over 1,000 tons of gold in both 2022 and 2023, the highest levels on record. While silver does not play the same reserve role as gold, this trend reflects a broader reassessment of the role of precious metals in the international monetary system. If this trend continues, it could potentially lead to increased silver holdings by some central banks, particularly those with significant mining production or industrial usage. Even without direct central bank buying, the monetary premium attached to gold tends to spill over into silver, supporting higher price levels for both metals.
- Financial Market Development: The evolution of financial markets for silver is likely to support greater investment participation and potentially higher prices over the long term. The development of silver-backed ETFs, futures options, and other investment products has made it easier for investors to gain exposure to silver without the logistical challenges of physical ownership. The CME Group continues to innovate with new precious metals products, including the recently launched weekly gold and silver options that provide more granular risk management tools for investors. Additionally, the potential development of a global silver spot price mechanism to replace the antiquated London fix could improve price discovery and market efficiency. These financial market innovations should increase the attractiveness of silver to a broader range of investors and potentially reduce its historical volatility premium relative to gold.
5 Potential Investment Strategy for 2026
Momentum traders focusing on the silver market in 2026 should prepare for a significantly more volatile environment than experienced in 2025. After a 144% annual gain, the risk of a sharp correction has increased substantially, and the market is likely to experience larger price swings in both directions as sentiment shifts. Successful momentum trading in this environment will require disciplined risk management, flexible positioning, and the ability to quickly adapt to changing market conditions.
- Technical Entry and Exit Points: Based on the extreme momentum readings from late 2025, the most likely scenario for early 2026 is a period of consolidation or correction. Traders should look for key support levels on the daily and weekly charts as potential entry points for long positions. The $65-69 per ounce zone represents an important technical level, as it corresponds to the 261.8% Fibonacci extension of the October 2025 decline wave. Additionally, the $50-55 per ounce area should provide substantial support, as it represents the psychological breakout point from late 2024. On the upside, traders should be prepared for potential challenges to the $75-80 per ounce zone if momentum reasserts itself, particularly if the US dollar weakens further or geopolitical tensions escalate.
- Volatility Management Strategies: Given the expanded volatility regime in silver markets, momentum traders should consider incorporating volatility-based position sizing into their strategies. One approach is to use the Average True Range (ATR) to determine position sizes, risking a fixed percentage of capital on each trade rather than a fixed monetary amount. For example, if the ATR is $3 and a trader is willing to risk 1% of a $100,000 account ($1,000), they would size their position at approximately 333 ounces ($1,000/$3). Additionally, traders should consider using options strategies to express their view with defined risk, such as call spreads or risk reversals rather than outright futures or long positions. The increased options liquidity in silver markets, particularly with the new weekly option products from CME, provides more sophisticated tools for managing directional exposure and volatility risk simultaneously.
Table: Momentum Trading Strategy Matrix for Silver in 2026
| Market Scenario | Technical Indicators | Strategy Recommendations | Risk Management |
|---|---|---|---|
| Continuation Rally | Break above $75, strong momentum, breadth positive | Add to long positions on pullbacks, trail stops higher | Use trailing stop-loss at 3-5 ATR below recent lows |
| Sideways Range | Prices between $60-75, volatility contracts, mixed breadth | Range trade with oscillators, fade extremes | Tight stop-losses outside range, position size conservatively |
| Sharp Correction | Break below $60, momentum negative, volume spike | Stand aside initially, look for support levels | Wait for stabilization before entering, avoid catching falling knives |
| Trend Reversal | Lower highs and lower lows, momentum turns negative | Establish short positions on rallies, target previous lows | Use option strategies to manage risk, avoid unlimited risk futures shorts |
5.2 For Long-Term Investors: Structural Opportunity
Long-term investors with a 5-year or greater horizon should focus on the structural fundamentals of the silver market rather than being concerned about near-term price fluctuations. The supply-demand imbalances driving silver’s long-term bull market are unlikely to be resolved quickly, creating what appears to be a multi-year opportunity for patient investors. The key to success in this environment is maintaining a strategic allocation to silver through market cycles while avoiding the temptation to trade on short-term volatility.
- Optimal Allocation Sizing: Determining the appropriate allocation to silver depends on individual risk tolerance and overall portfolio objectives, but for most investors, a 5-15% allocation to precious metals is reasonable within a diversified portfolio. Given silver’s higher volatility relative to gold, most advisors recommend allocating approximately one-third to one-half of the precious metals allocation to silver. For a moderate risk investor with a 60% equity/40% fixed income allocation, this might translate to a 3-6% overall portfolio allocation to silver. This provides sufficient exposure to benefit from silver’s long-term potential while limiting the impact of its periodic sharp drawdowns. Importantly, investors should dollar-cost average into silver positions over time rather than making lump sum investments, particularly after a strong performance year like 2025.
- Vehicle Selection for Long-Term Exposure: Long-term investors have several options for gaining silver exposure, each with distinct advantages and disadvantages:
- Physical Silver: Buying bars, coins, or rounds provides direct ownership and eliminates counterparty risk, but comes with storage costs, liquidity constraints, and potentially higher premiums. Physical silver is most appropriate for investors who value tangible ownership and are willing to accept the logistical challenges.
- Silver ETFs: Products like the iShares Silver Trust (SLV) offer instant liquidity, competitive expense ratios, and ease of trading within brokerage accounts. They are ideal for investors who want pure price exposure to silver without the complications of physical ownership. The tax treatment of ETFs is generally favorable, with most taxed as collectibles (28% maximum federal rate) rather than ordinary income.
- Mining Equities: Silver mining stocks provide leverage to the metal price through operational leverage and exploration success. Companies like Fresnillo, Hecla Mining, and Pan American Silver are well-established producers with diverse asset bases. However, mining stocks introduce company-specific risks, management execution risk, and the potential for value destruction through poor capital allocation. Investors should consider a diversified basket of mining stocks to mitigate these risks.
- Futures and Options: While typically more appropriate for shorter-term trading, futures can be used by sophisticated long-term investors to implement tactical tilts or hedge existing positions. The highly leveraged nature of futures makes them inappropriate for core long-term allocations for most investors due to the risk of liquidation from margin calls during adverse price moves.
Deep Dive: Advanced Silver Valuation Metrics
For sophisticated investors seeking to deepen their understanding of silver’s valuation dynamics, several advanced metrics can provide additional insight into whether the metal is overvalued or undervalued relative to its historical relationships:
- Gold-Silver Ratio: This ratio measures how many ounces of silver are required to purchase one ounce of gold. Historically, this ratio has averaged approximately 60:1, but has fluctuated between 40:1 and 80:1 in most market cycles. During extreme market conditions, it has briefly reached 100:1 (as in early 2025) or 30:1 (as during the 1980 Hunt Brothers bubble). A reading below 50:1 suggests that silver may be expensive relative to gold, while readings above 70:1 suggest silver may be relatively cheap. The ratio stood at approximately 64:1 at the end of 2025, suggesting silver was somewhat rich relative to gold but not at historical extremes.
- Real Silver Price: Adjusting silver prices for inflation provides perspective on the metal’s long-term value. In inflation-adjusted terms, silver’s 2025 high of approximately $84/oz was still below its 1980 all-time high of approximately $120/oz in today’s dollars. This suggests that even after the 2025 surge, silver remained below its previous inflation-adjusted peak, potentially leaving room for further appreciation. However, this metric should be used cautiously, as the supply-demand fundamentals for silver have changed dramatically since 1980, with industrial demand now accounting for approximately 59% of total consumption versus less than 30% in the 1980s.
- Silver Production Cost Curve: Understanding the cost structure of silver production provides insight into potential price floors. The all-in sustaining costs (AISC) for silver miners have increased steadily over the past decade, reaching approximately $18-22 per ounce for many primary producers and higher for marginal operations. With silver prices at $84/oz, even high-cost producers are generating substantial operating margins, which could incentivize increased supply over the long term. However, the byproduct nature of much silver production means that these costs are only partially relevant to supply decisions, as many producers would continue mining even if silver prices fell below their AISC because they are primarily targeting other metals.
6 Conclusion and Investment Outlook
The extraordinary performance of silver in 2025 was driven by a rare convergence of structural supply deficits, surging industrial demand from green technologies, and favorable monetary conditions. Looking ahead to 2026 and beyond, the silver market presents a complex dichotomy between speculative excess in the near term and exceptional long-term fundamentals. For investors, the key challenge is navigating this duality by maintaining a strategic allocation to silver while managing the risks of a potential mean reversion in the short term.
The long-term case for silver remains exceptionally compelling, supported by multiple secular trends that are unlikely to reverse quickly. The energy transition represents perhaps the most powerful demand driver in history for industrial commodities, and silver stands at the center of this transformation due to its unique properties and limited substitutes. On the supply side, the geological constraints and byproduct production dynamics that characterize the silver mining industry suggest that supply growth will remain constrained for the foreseeable future. This combination of expanding demand and inelastic supply creates the conditions for a sustained period of elevated prices that could last for years.
For momentum traders looking to participate in the silver market in 2026, the environment will likely be more challenging than 2025, requiring greater discipline and risk management. The most successful approach will be to maintain flexible positioning and to respect both support and resistance levels rather than chasing breakouts. The use of volatility-based position sizing and options strategies can help manage the expanded risk profile that follows a parabolic advance.
For long-term investors, the current period of consolidation or correction should be viewed as an opportunity to establish or add to positions in what remains a fundamentally sound bull market. The key is to focus on the structural drivers rather than being distracted by short-term price volatility. By maintaining a disciplined allocation to silver through dollar-cost averaging and avoiding the temptation to trade on market noise, long-term investors can position themselves to benefit from what may still be the early stages of a historic bull market in the metal.
Ultimately, silver’s dual nature as both a monetary asset and an industrial metal makes it uniquely positioned to benefit from the major macroeconomic trends of the coming decade. While the path is unlikely to be smooth and may include periodic sharp corrections, the fundamental trajectory remains pointed upward. Investors who understand this dynamic and maintain appropriate position sizes will be best positioned to capitalize on what remains one of the most compelling investment opportunities in the global marketplace.
Disclaimer
This article is a record of the thinking behind a personal investment decision. It does not represent any recommendation to purchase any stock mentioned in the article. As always, readers are strongly advised to do their own due diligence before making any investment decisions.